
Netflix’s “Big Water,” which was watched by more than 10 million households worldwide, reminded us of the catastrophic events of 25 years ago, when a huge flood wave was approaching Wroclaw (a big city in the southern part of Poland), and which consequently led to the flooding of parts of the city. Of course, this flood did not affect only the residents of Wroclaw. The area that was flooded was much wider as the waters of the basins of many rivers flooded at the time. It is generally estimated that the losses that were incurred as a result of the “Flood of the Millennium”, as this flood is called, exceeded the value of $3.5 billion [1].
One of the reasons for this event was heavy rainfall. However, we do not find a term “heavy rainfall” in the literature. Therefore, it may be worth quoting briefly hydrological terminology at this point.
In this regard, the most recognizable is the classification developed by Chomicz, which refers precisely to the intensity of rainfall by defining ordinary rains, heavy rains, torrential rains and driving rains.
Rainfall intensity (intensity) is the ratio of the amount of rainfall to the duration of the rainfall and is measured in millimeters per minute. It is also measured in units of rainfall volume per unit of time, e.g. a second, and per unit of area, e.g. ha or km2. That is, if 1 mm of rain falls on an area of 1 hectare then the volume of precipitation will be 10 m3, or after conversion – if 1 mm of rain falls on an area of 1 m2 then the volume of precipitation will be 1 dm3 (1 liter). The volume of precipitation that fell per unit area per unit time [dm3/s ha] is taken as the precipitation yield.
The duration of rainfall is also an important parameter, which is considered to be the time from the onset of rainfall to its end. And going back to Mr. Chomicz, in analyzing the dependence of rainfall yield on its duration, he drew up nomograms, where on the abscissa axis we have rainfall duration, and on the ordinate axis we have rainfall yield understood as the total amount of rainfall. This allowed him to classify rains using a simple equation:

u – rainfall yield in mm
α – rainfall yield factor α = 2(k/2)
k – Chomicz scale number
t – duration of rainfall in minutes
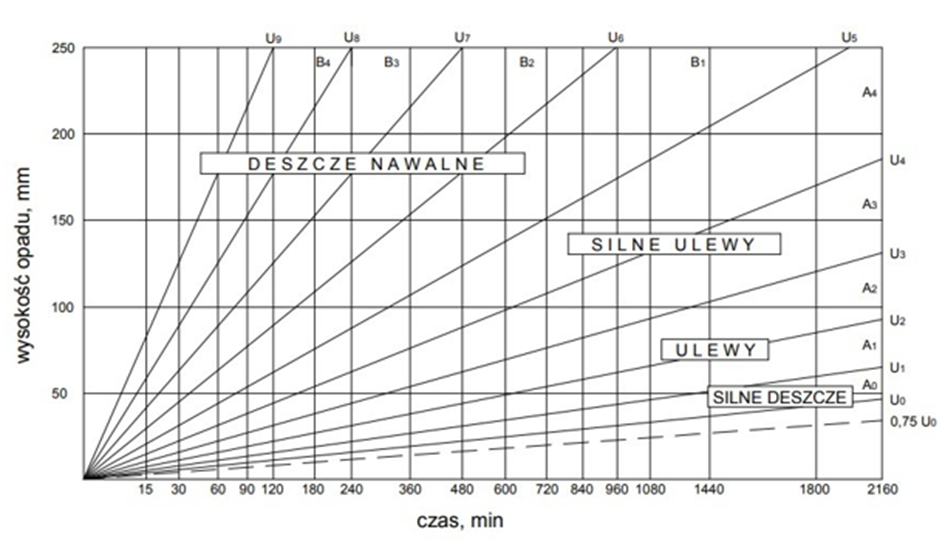
It is considered that the driving rains, by virtue of their efficiency are associated with the threat of flooding.
Let’s check now whether the ongoing climate changes have brought us a significant increase in the frequency of heavy rains in recent years. Data is provided by the Institute of Meteorology and Water Management (IMGW) in Warsaw.
The directory “meteorological_data” contains files in csv format from all rainfall stations (parameter: precipitation) from the period of 1950-2022 showing daily rainfall totals. Unfortunately, no data on rainfall duration. To overcome this I will assume that we are dealing with heavy when the daily precipitation is above 44 mm (based on Chomicz table).
Meteorological stations
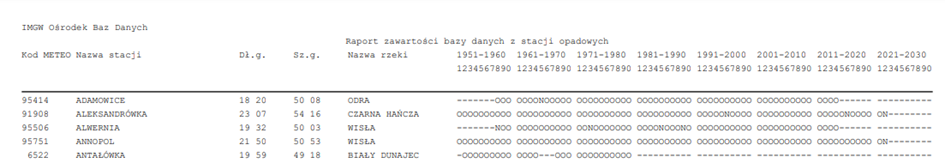
Let’s start with the meteorological stations that collect precipitation data. In the directory “meteorological data” there is a file named mapa_zawartosci_opad. It is saved in pdf format. We can find a dozen pages of information about meteorological stations in this file with such parameters as: the code of the station, the name of the station, its longitude and latitude. We also have information about the operation of the station over the years, ie.
We need information about the spatial location of stations from this file. I will use the PyPDF2 library to read the content of the file.
Then a little more manipulation on the data: cleaning, moving in rows, finally calculating the decimal form of longitude and latitude and the station data is ready. With the help of the Folium library it can be displayed.
In general, we have 1626 stations in Poland. Their distribution over the territory of Poland is fairly homogeneous.
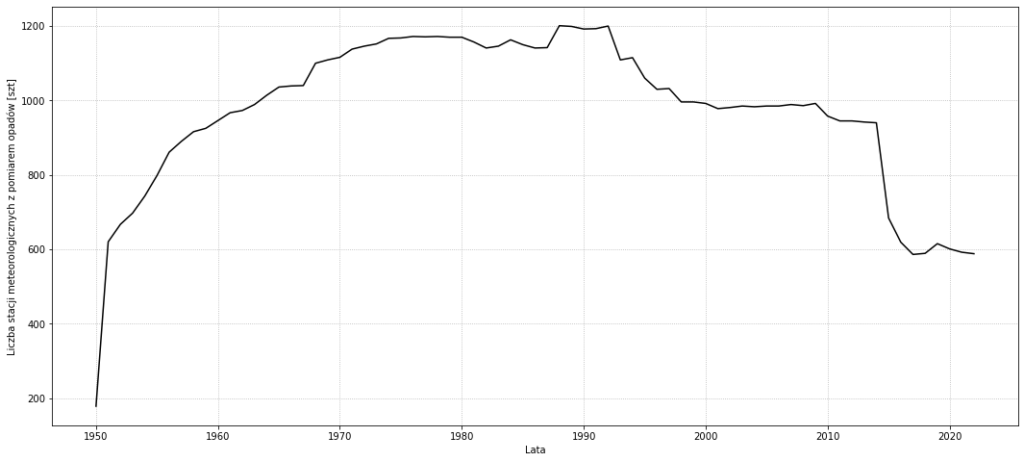
But the question has been raised about the activity of stations over the previous years. It is obvious that stations may have been established at different times, some may have been closed, new stations appeared. In result the number of active stations where measurements of precipitation were done was changing over years. The largest number of meteorological stations with precipitation measurements operated in the late 1980s. There were more than 1,200 of them. In recent years, we have seen a significant reduction in the number of active meteorological stations measuring precipitation in Poland.
The distribution of active weather stations in the last five years is shown in the map below. The vast majority of active stations were located in the western part of Poland. The smallest number of stations operates in the Podkarpackie, Lubelskie and Mazowieckie provinces. Particularly dense stations are located in the southern belt of mountainous regions, which is of course justified.
Rainfalls
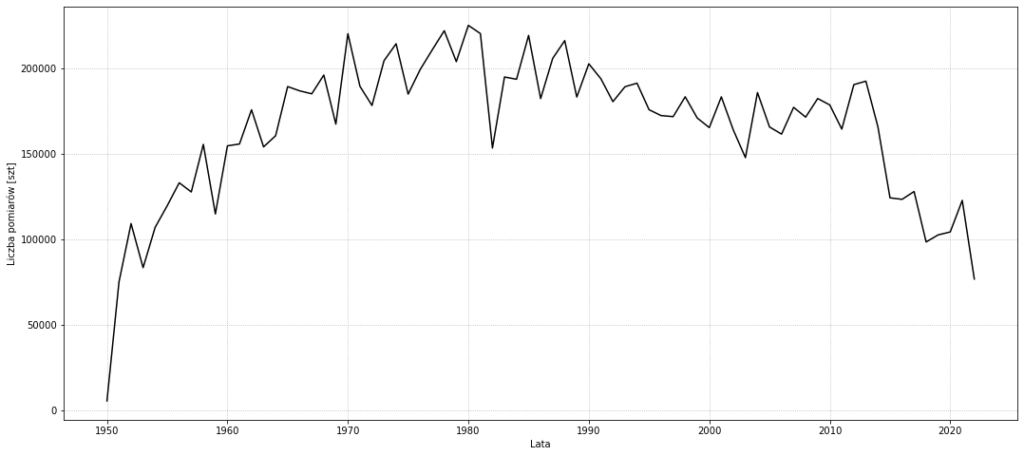
Associated with the activity of weather stations is their measurement activity. In the 1980s, the number of annual precipitation measurements exceeded 200 thousand. Since 2013, the number of measurements has definitely decreased. Currently, the number of measurements per year fluctuates is much lower.
Let’s now trace the number of occurrences of driving rain in Poland over the past 72 years. The multiplication of cases, where the amount of rainfall exceeded the accepted 44 mm, we observed in 1997 and 2010. Knowing today what happened, this is no surprise to us (1997 Central European flood, 2010 Central European flood)
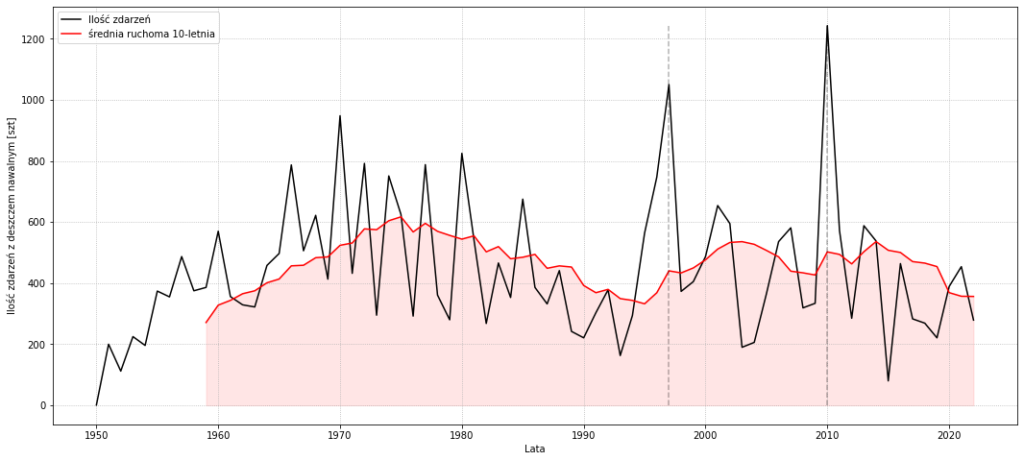
What is interesting recent years have been far less plentiful in heavy rains. There are fewer instances of their occurrence in the 1970s. One can also detect a pattern in the graph. The period of reduced intensity of cases of heavy rainfall from 1985 – 1995 or 2002 – 2009 was followed by an accumulation, such as in 1997 or 2010. So, after the current period of 2011 – 2022, do we also face something similar in the coming years? The previous period was just 13 years.
Flood 1997
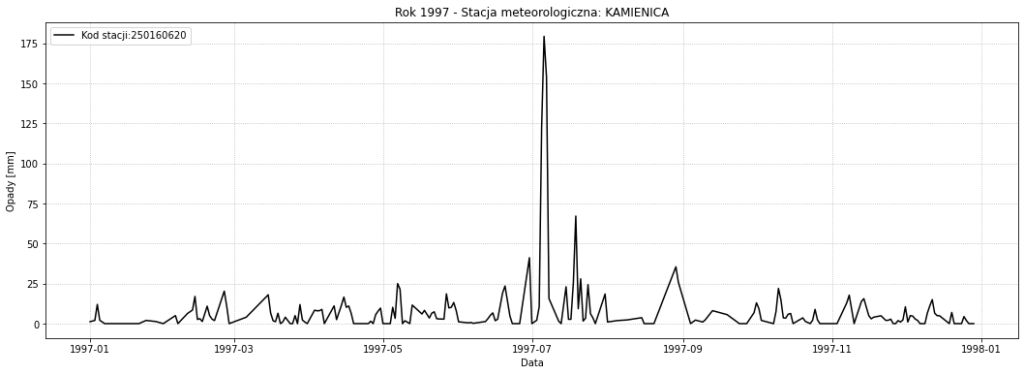
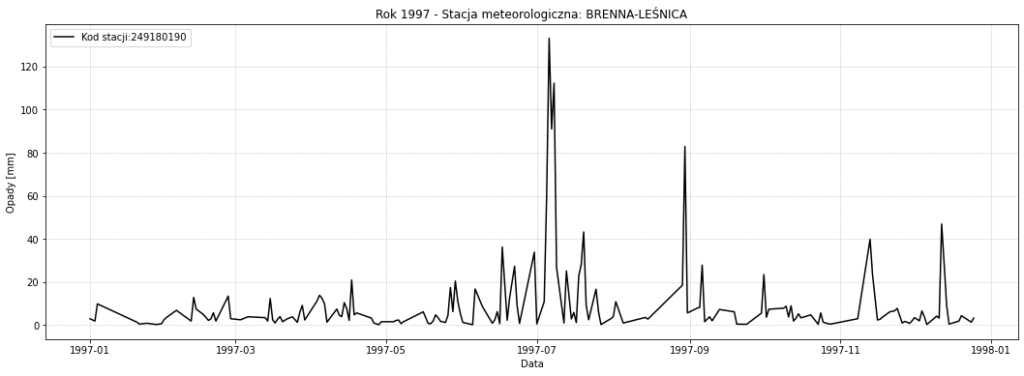
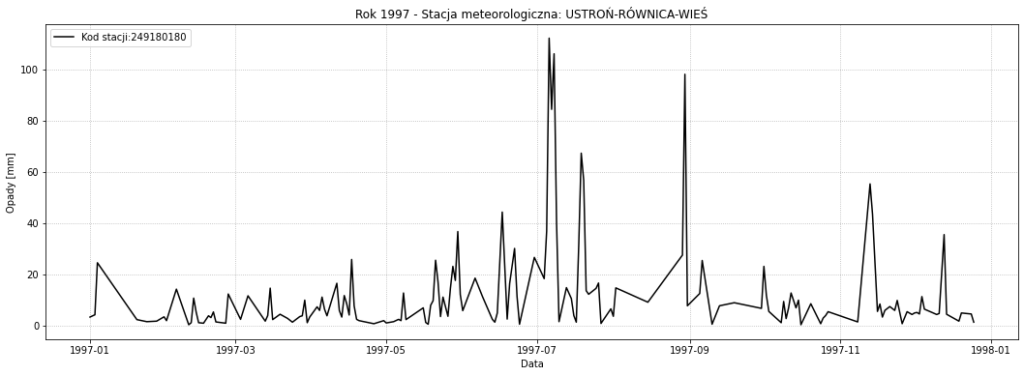
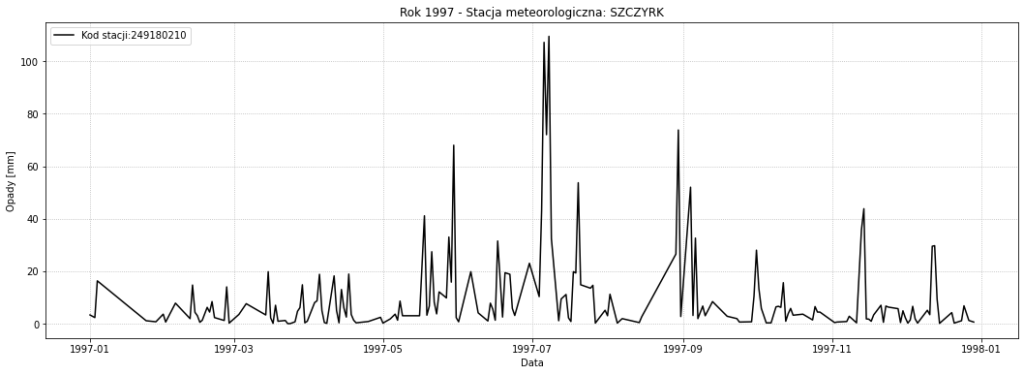
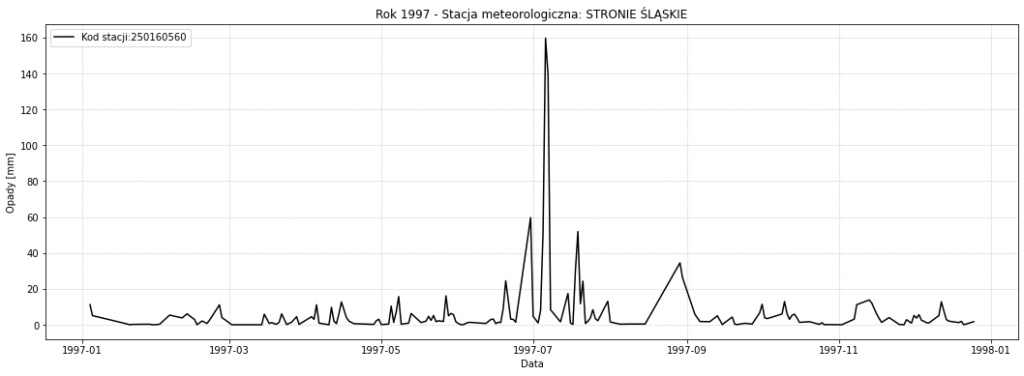
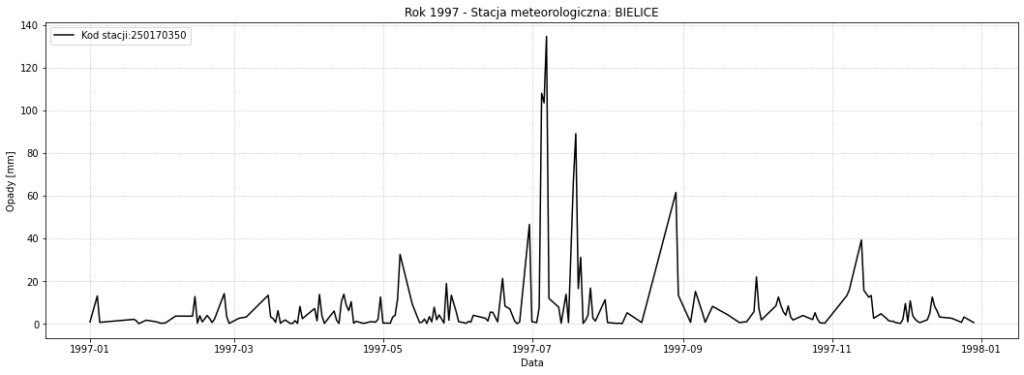
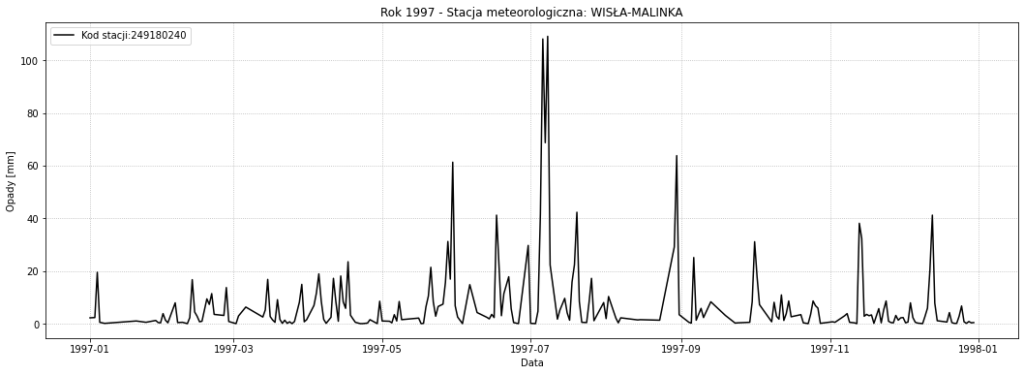
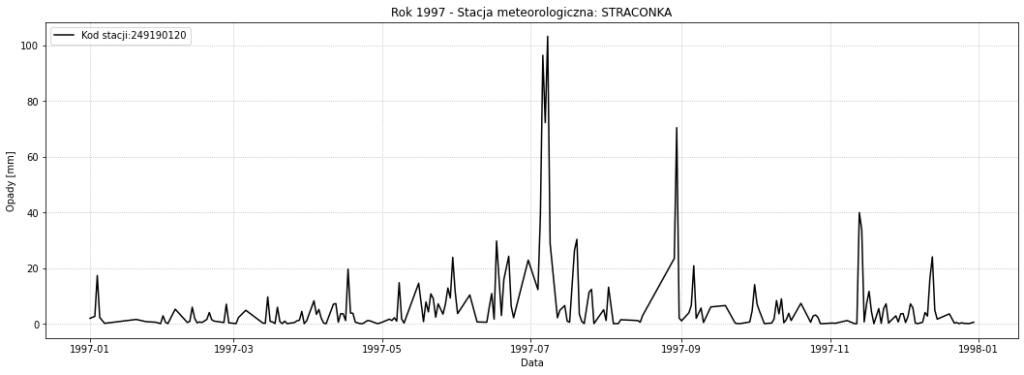
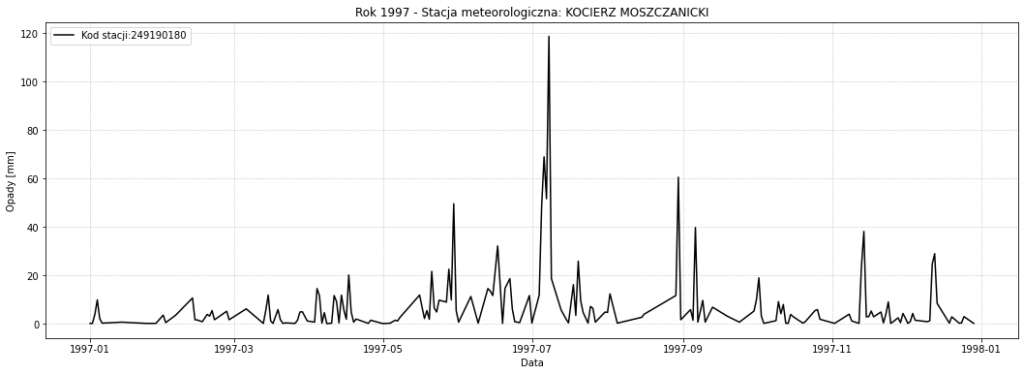
Let’s take look at where the most intense precipitation was recorded in 1997. For this purpose ten meteorological stations where measurements showed the highest intensity of precipitation are identified below. From the charts it is clear that it was the first week of July 1997 that had a significant impact on what happened next in Wroclaw and other places in southern Poland.

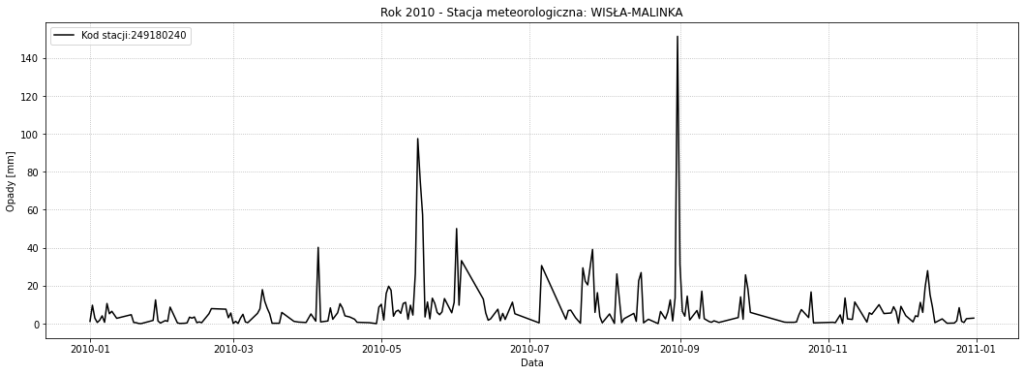
Flood 2010
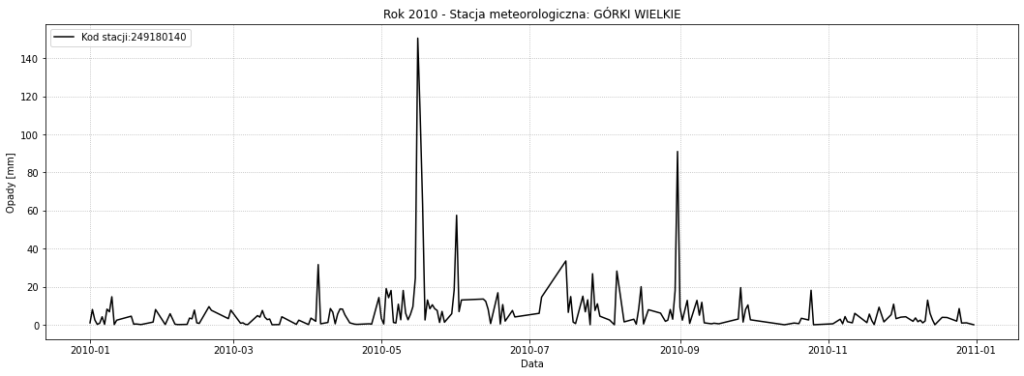
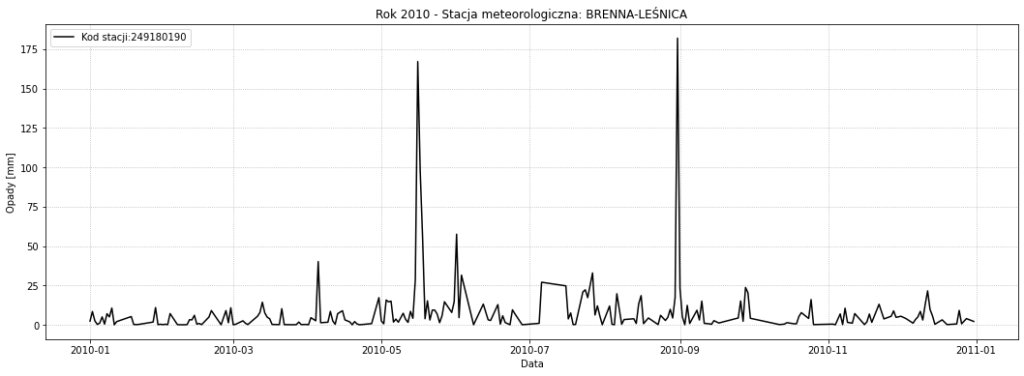
In 2010 we had two waves of intense rainfall in Poland. The first took place at the end of the second week of May. And it was responsible for the flood, which is considered one of the largest in Poland. Let me just mention that while in 1997 we saw floods mainly in the Oder River basin, this time they occurred in the Vistula River basin. The culmination of the surge on the Vistula was the largest in the last 160 years. The second wave of intense precipitation occurred in late August and was concentrated mainly in the Upper Silesia region. A record rainfall of more than 200 mm was recorded in Szczyrk station at that time.


Conclusions
The analysis showed that in the last decade there has been a significantly reduced incidence of heavy rains. The amount is significantly less than, for example, in the 1970s.
On the other hand, a period of reduced incidence of heavy rainfall is followed by a cumulative one. We observed it in 1997 and 2010. The period is thirteen years. So should we expect that the next flood in Central Europe will happen this year? It’s better to be prepared.
Have there been any changes in infrastructure or flood management systems since the last major flood to prevent a similar event in 2023?
Of course, there has been an improvement in flood safety over the past 20 years. However, the needs are definitely greater than the possibilities. More information about the actions taken can be read at https://www.powodz.gov.pl/en
Are there any specific regions or areas that are particularly vulnerable to experiencing a major flood in 2023?
The conducted analysis concerned Poland. In Poland, we have two main rivers, the Odra and the Vistula, as potential areas where flood hazards may occur.
How does the current weather pattern or climate conditions contribute to the likelihood of another major flood happening in 2023?
It is generally estimated that the losses ?
Telkom University