Perhaps I can start by saying that the energy generated from renewable energy sources is directly related to meteorological factors such as rainfall, wind, solar radiation, etc. If the sun shines we get energy from photovoltaic installation. If it rains we collect water for hydroelectric power plants, and if the wind blows it drives us wind turbines. Based on weather forecasts, we are able to predict how these parameters will develop in the short, medium or long term. However, we must bear in mind that the longer the forecast, the higher the error could be. But on the other hand, mostly the medium- and long-term forecasts are the most interesting, and have significance in many aspects of our socio-economic life.
The European Centre for Medium-Range Weather Forecasts (ECMWF) was established in Europe in 1975. It is both a research institute and a 24-hour operational service, creating and disseminating numerical weather forecasts for member countries. ECMWF’s computer center is impressive. As Poles we can regret that Poland is not a direct member or even a cooperating member of the ECMWF organization.

Fortunately, ECMWF is a member of the European Commission’s Copernicus space program, which can be called a key component for Earth observation due to its provision of information on climate change, atmospheric composition, flood or fire risk.
Climate Data Store
Here, I will be interested in the topic of climate change. Within this service, specifically as the Climate Data Store (CDS), I will look for some predictive information on wind speeds at a height of 10 meters (https://climate.copernicus.eu/climate-datasets)
The Climate Data Store is the core infrastructure that supports the implementation of the C3S (Copernicus Climate Change Service) providing basic climate variables, climate analyses, reanalyses, forecasts and indicators at temporal and spatial scales. The CDS has been designed so that different methods of data acquisition can be used, i.e. through a web interface, via an API, or using the CDS toolkit. But in general, the first step is to create an account on the site. Registration goes smoothly with a required email confirmation. After that, we already have access to the vast collection of data and applications. It is worth noting that this access is free of charge.
We can use a linear or advanced search engine to find the information we need. Admittedly, it is necessary to read well into the description of a given set of data.

We enter the keyword “wind” and “seasonal forecasts” from the types of products available. We get a list of datasets, from where we are able to choose the most appropriate material. Let’s say it will be “Seasonal forecast anomalies on single levels”.
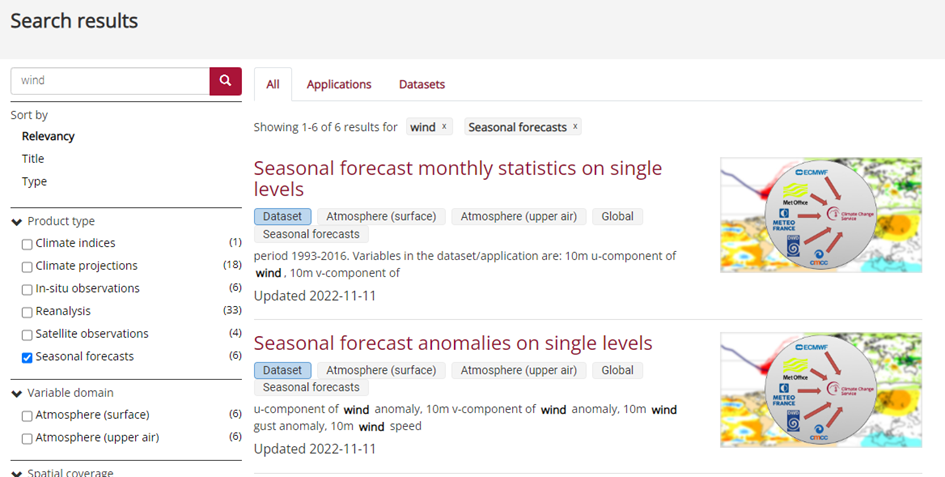
As the name implies, these will be forecasts of anomalies, i.e. events different from multi-year averages. Why anomalies? And because such modifications are precisely the essence of medium- and long-term forecasts. The model includes many key components specific to the atmosphere, oceans, or land surface. And it is a multi-system, which means that the data produced by the state-of-the-art seasonal forecast systems developed, implemented and operated at forecasting centers in European countries are collected, processed and combined with each other. Anyway, as I mentioned, it is worth taking the time to read the description of the selected dataset, and I also encourage you to read the documentation of the dataset. Each dataset is very well cataloged and described in four tabs: Overview, Downloaded data, Quality assessment and Documentation.
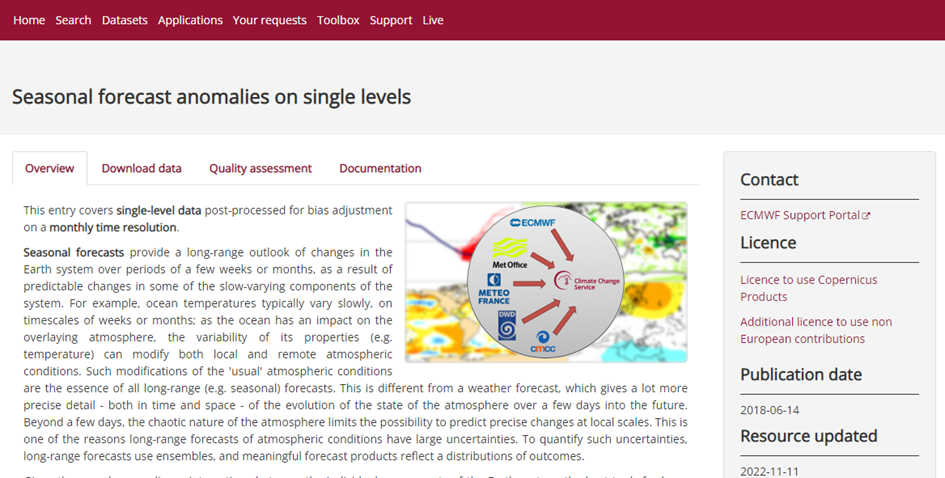
Downloading data from CDS
So, after reviewing the contents, we can proceed to download the data. First we need to select the necessary data. For the implementation of an example, I will select the following values:
| Originating centre | ECMWF |
| System | 5 |
| Variable | 10m wind speed anomaly |
| Product type | Monthly mean |
| Year | 2022 |
| Month | October |
| Leadtime month | 2 |
| Geographical area | [55,22,48,25] – współrzędne geograficzne obejmujące obszarem Polskę |
| Format | GRIB |
A cool thing – at the bottom of the page we have a button “Show API request”, which generates for us the format of our API request. We will simply be able to copy it for ourselves and apply it.
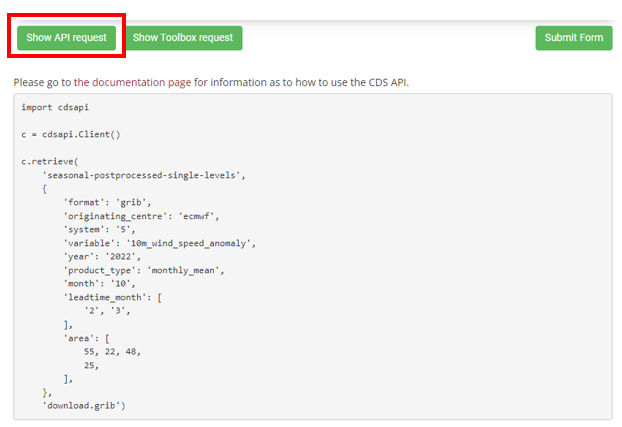
Now we move on to the Jupyter Notebook environment, where we will perform visualization of the acquired data from CDS. Remember you need to register an account with CDS in advance to obtain a user ID and API key. The installation method is presented here.
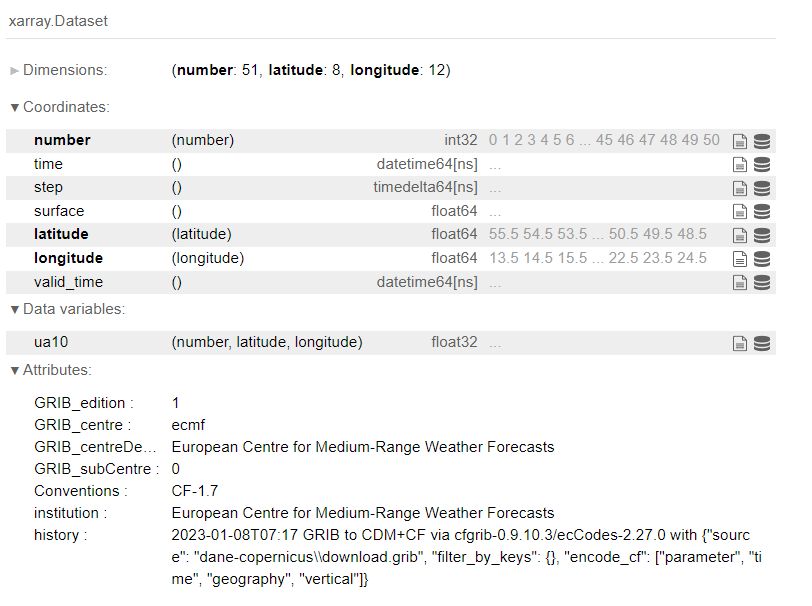
For data format we choose GRIB, which is commonly used to disseminate atmospheric model data. A xarray library has been developed to analyze and visualize such data. We use the open_dataset method, where we have to specify the name of the file and the engine. In this case “cfgrib”.
The data can be easily viewed using the icons at the end of each line. Data with forecasts for possible wind speed anomalies at a height of 10 meters are posted under the variable ua10. Of course, viewing in a tabular layout is not pleasing to the eye. Hence, I will convert the forecast results into a map.
To do this, I import the geopandas library, which will allow me to load the external borders of Poland from a shapefile I have. This file can be obtained from https://www.naturalearthdata.com/. I will also use the cartopy library for determining the projection of the spatial map being created.
The code is shown below.
Electricity yield from wind power plants in Poland
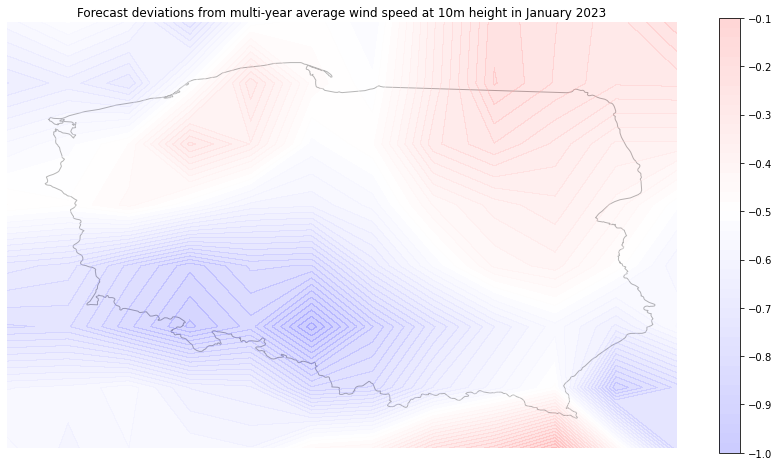
The end result is a map showing the forecast of deviations from the multi-year norm for wind speeds in January 2023 at the height of 10 meters. With the adopted scale, we can read the deterioration of windiness throughout Poland. The smallest differences from the multi-year average will be noted in northeastern Poland. The largest differences will occur in the southern part of Poland. In general wind energy yield will be lower than multi-year average.
Links
- Copernicus Climate Change Service – https://climate.copernicus.eu/climate-datasets
- European Centre for Medium-Range Weather Forecasts – https://www.ecmwf.int/en/forecasts/datasets
- Python interface to map GRIB files to the NetCDF Common Data Model – https://pypi.org/project/cfgrib/
- Xarray documentation – https://docs.xarray.dev/en/stable/index.html
- Geopandas – https://geopandas.org/en/stable/getting_started.html
- Cartopy – https://scitools.org.uk/cartopy/docs/latest/index.html

Do you have any recommendations on how we can use this wind speed anomaly data for renewable energy planning or decision-making?
I see some recommendations on how wind speed anomaly data can be used for renewable energy planning or decision-making. There are:
– site selection: in this aspect wind speed anomaly data can be used to identify areas with high wind energy potential. By analyzing historical wind speed data and wind speed anomalies, renewable energy planners can identify locations.
– energy yield estimation. Here wind speed anomaly data can be used to estimate the energy yield of wind turbines. In result you are able to achieve the potential energy production of a wind turbine.
– operation and maintenance. By monitoring wind speed anomalies, renewable energy operators can identify potential issues with turbine performance and make adjustments to optimize energy production.
Then It should come as no surprise that an organization called The European Centre for Medium-Range Weather Forecasts
Telkom University