While preparing material for students for a seminar on renewable energy sources, I came across an interesting dataset that now I am happy to share with you through this post. The Energy collection could be found at https://ourworldindata.org/energy. It is interesting not only because of its constant updating by the authors, but also because of the comprehensiveness of the data, as it combines data from several diverse data sources. These sources include: Statistical review of world energy (BP), International energy data (EIA), Energy from fossil fuels (The Shift Dataportal), Global Electricity Review (Ember) and European Electricity Review (Ember). In one place we have historical and current data on sources of energy generation, energy consumption, etc. in any part of the world. A description of the data found in the Energy collection is summarized here (https://github.com/owid/energy-data/blob/master/owid-energy-codebook.csv). As you can see from it, the scope is wide.
However, I will be interested in data on renewable energy sources, hence only such columns will be selected from the collection for further analysis. As a result, after the initial extraction of data, those on renewable energy sources were collected in 35 columns.
The code and datasets used in this post are available here.
Energy from renewable energy sources in Poland
The first data on energy generated from renewable sources was recorded in Poland in 1965, although it is only the last two decades that have brought significant changes in this regard, mainly due to international commitments and the implementation of EU energy policy.
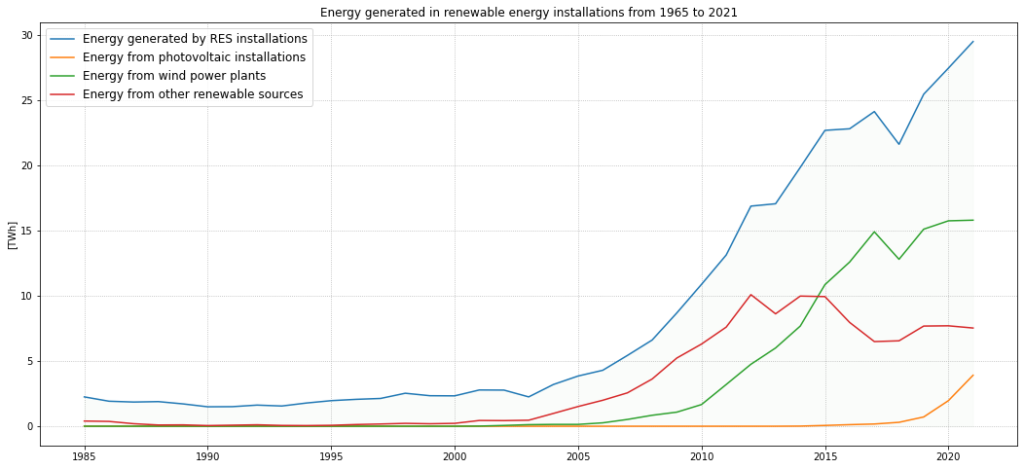
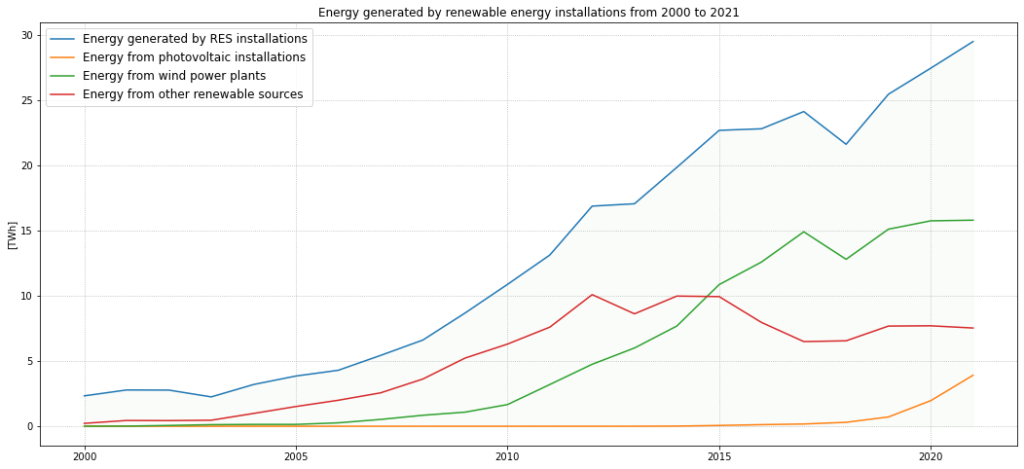
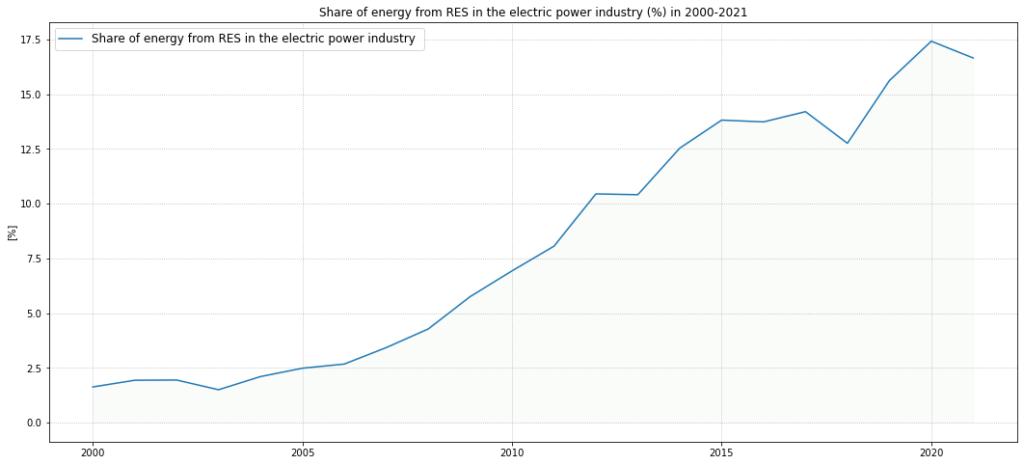
As a result in 2021, renewable energy installations produced 30.1 TWh of electricity. Just ten years ago it was only 13.1 TWh. The largest source of renewable energy in Poland is wind power plants, although the capacity of photovoltaic installations has increased significantly in recent four years. Currently, energy from renewable energy is already 16.9% of the total electricity generated in the Polish energy mix. In 2004, when Poland joined the European Union, it was less than 2%.
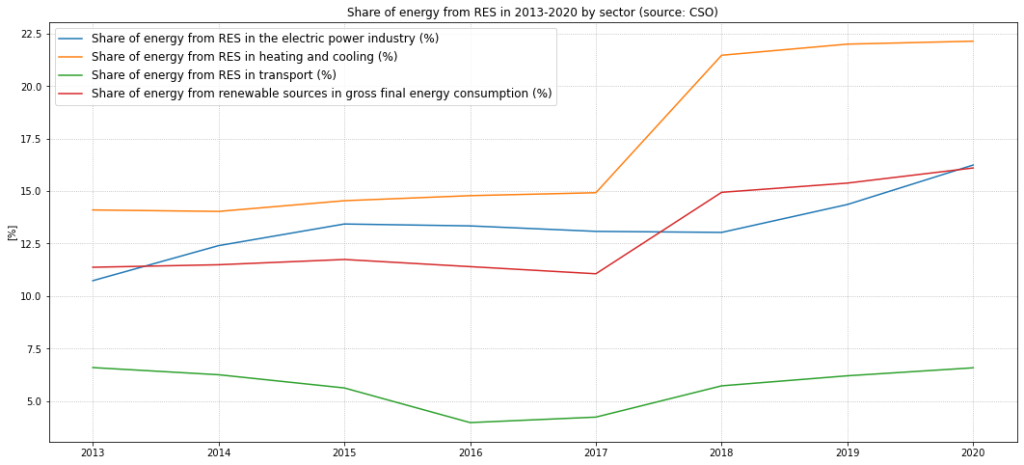
Let’s take another look at the share of energy from RES by sector. The largest share of energy from renewable energy is in heating and cooling sector. This share exceeds 20%. The highest value of 22.14% was recorded in 2020. The share of this energy in transportation is now at around 6.5%. In 2016 the smallest share of no more than 4% was observed. The share of renewable energy in gross final energy consumption is at 16%.
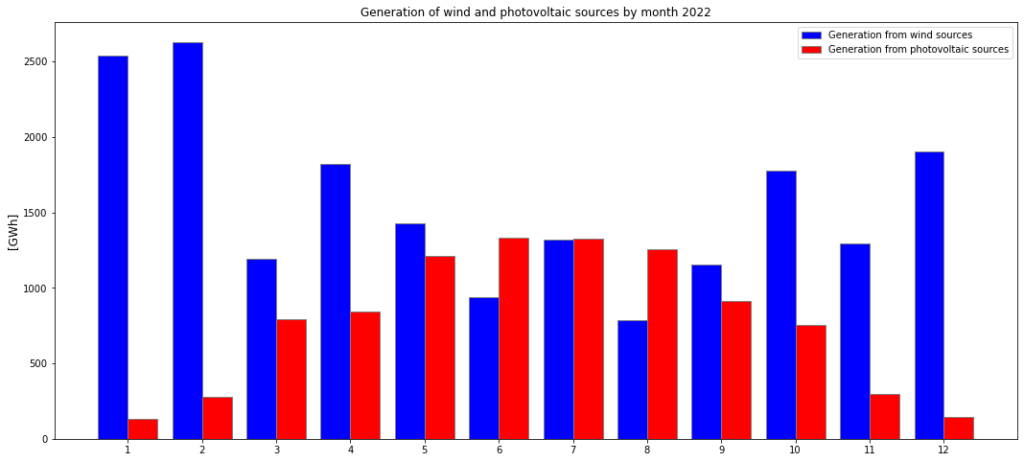
In 2022, the amount of energy generated from photovoltaic sources amounted to 9.29 TWh despite 3600 hours without generation. The maximum generation from photovoltaic installations took place on September 7 between 12 and 1 p.m. 6711.31 MWh of electricity was generated then.
From wind sources, generation in 2022 was 18.77 TWh. There were no empty hours, although the weakest winds were noted on June 8. Between 9 a.m. and 10 a.m. on that day only 14.73 MWh were obtained from wind energy plants. The strongest windmills were spinning on April 5 between midnight and 1 a.m. At that time generation was 7185.17 MWh.
For wind sources, the best months were January and February, while for photovoltaic sources June and July.
Energy from renewable energy sources in the world
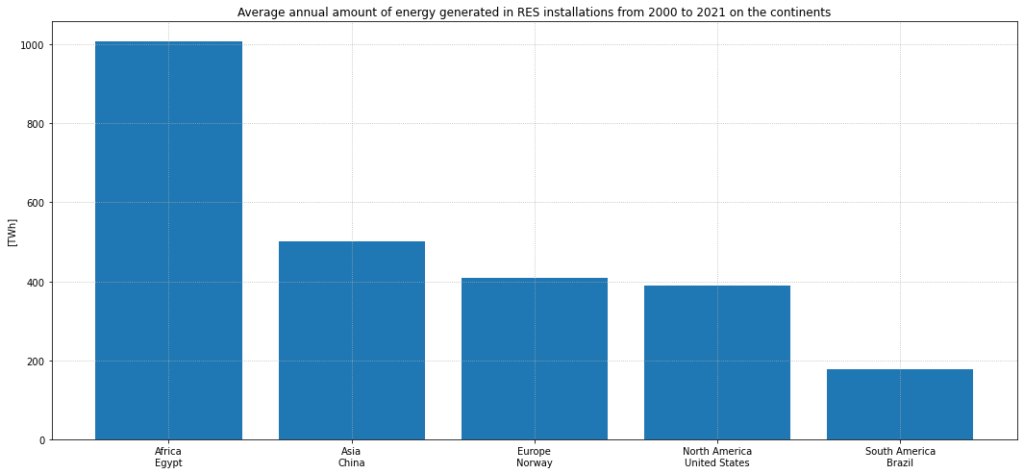
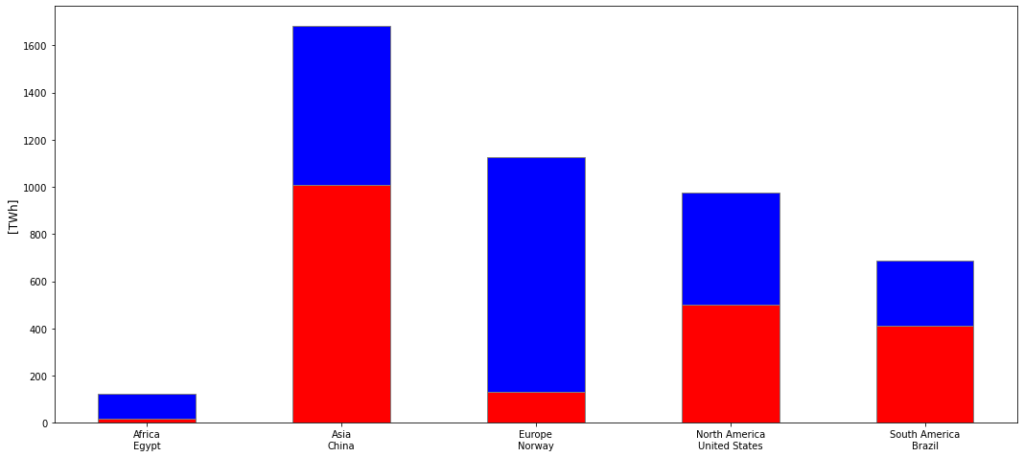
Now let’s take a look at the structure of renewable energy producers in the world and ask the question, which continent produces the most energy from renewable sources? To do this, let’s consider the annual average value for the last 20 years. The leading continent is Asia, the second is Europe, and the third is North America. Asia’s share of electricity generated from RES is 36.6%.
The world leaders in RES energy production are China, the United States, Brazil, Canada and Russia.
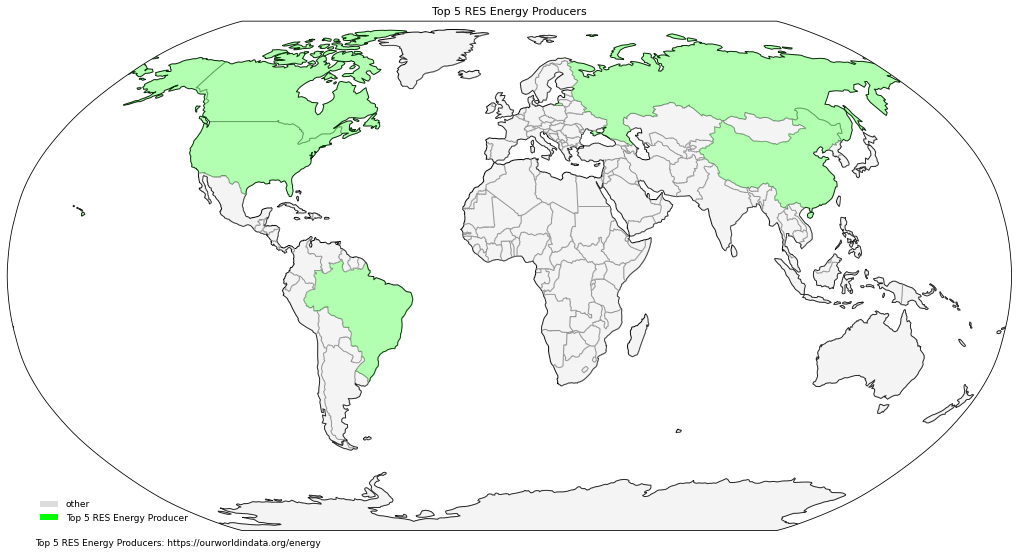
Not coincidentally, these are also the world’s largest countries by area, which may suggest that energy from agricultural or forest biomass is an important part in the energy balance.
1 Russia 17,098,242 km² (Asia and Europe)
2 Canada 9,984,670 km² (North America)
3 China 9,596,960 km² (Asia)
4 USA 9,525,067 km² (North America)
5 Brazil 8,515,767 km² (South America)
China is the largest producer of energy from RES. And this is the result of the last fifteen years. The breakthrough came in 2005 with the signing of a law regulating the development of a low-carbon economy. The law regulated a system of feed-in tariffs, subsidies and concessions which gave a strong impetus to the development of this type of energy source in China. In addition, it imposed an obligation on power companies to purchase electricity from renewable sources.
In 2021, the amount of electricity that was generated from renewable energy carriers in China was nearly 2,500 TWh.
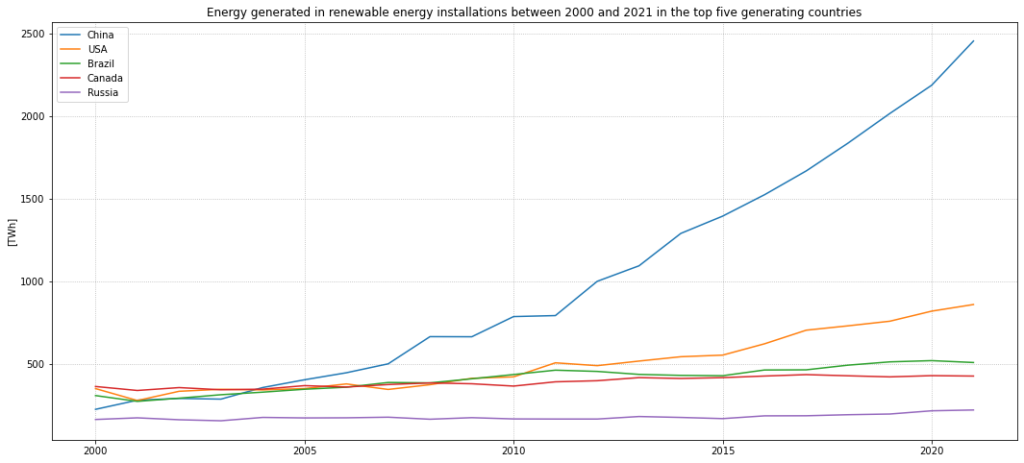
The share of the top five countries in the amount of energy generated from RES in the last two decades is 53.4%.
The leader country against the energy generated within the continent is as follows:
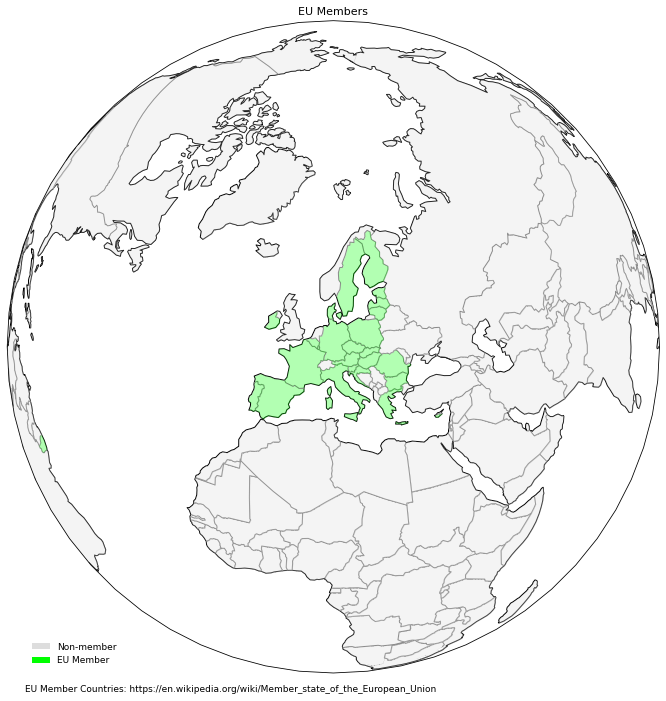
Energy from renewable energy sources in EU countries
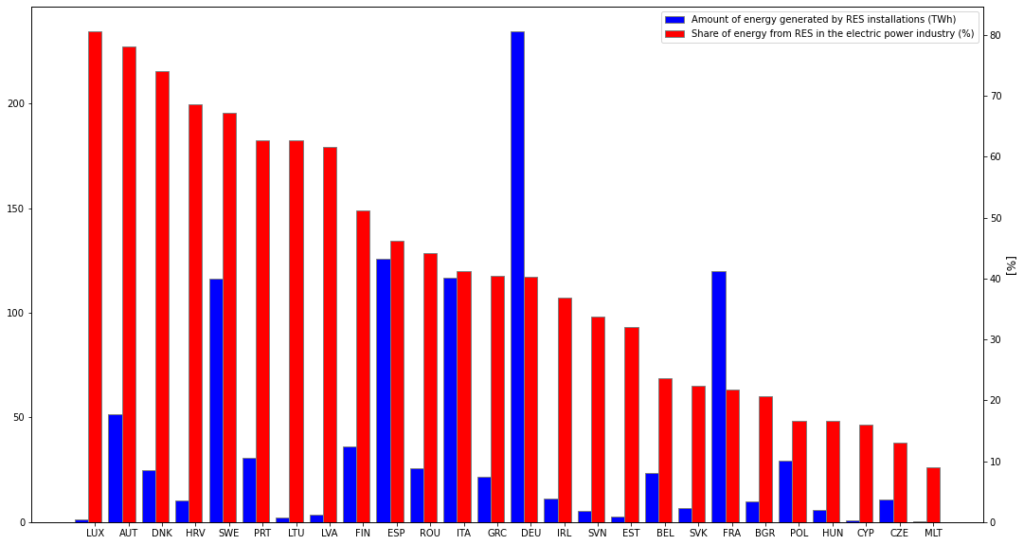
The chart below shows the dependence of the share of energy from RES in the electricity sector in the EU-27. The red bar is the percentage share. The blue bar is the amount of energy generated by RES installations in 2021. The largest share of renewable energy is generated in countries such as Luxembourg, Austria and Denmark. The share exceeds 75%, although in each country the amount of energy generated is significantly different. In Austria, 51.45 TWh were generated, in Denmark 24.83 TWh, while in Luxembourg it was only 1.12 TWh. Unfortunately, as Poland, we have nothing to boast about. As I mentioned above, the share of energy from RES in 2021 was 16.9 percent. This gives us fifth place from the end. Only Hungary, Cyprus, the Czech Republic and Malta generate less energy from RES than us.
What is the Energy collection mentioned in the post, and where can it be found?
The Energy collection could be found at https://ourworldindata.org/energy